
Pennies from Haven: Wages and Profit Shifting
There is no longer any debate about whether some multinationals avoid taxes by shifting profits overseas. According to Tørsløv, et al. (2018) the amount shifted annually is approaching $1 trillion. What is less well understood, however, is what happens to the money not spent on taxes. Put simply, if shifting profits leaves more money at the firm's disposal, where does it show up? In Alstadsæter, et al. (2022), we use matched employer-employee data from Norway to investigate one possibility: that at least some of it ends up in workers' pockets via higher remuneration.
We are not the first to examine the link between corporate taxes and wages. We build on the existing literature by recognizing that, by shifting profits to a tax haven affiliate, multinationals have the ability to reduce their global tax bill. With this in mind, we compare workers' wages in firms that are linked to a tax haven affiliate – which we call “profit shifters” – to those that do not. Although it may be presumptive to assume that having a haven affiliate means a firm is actively profit shifting, our data indicate that Norwegian firms with a haven affiliate have a return on assets 26% lower than comparable firms, i.e., their profits are markedly lower than what we would otherwise expect. Thus, the data suggest that having a haven affiliate is a strong indicator of potential profit shifting.
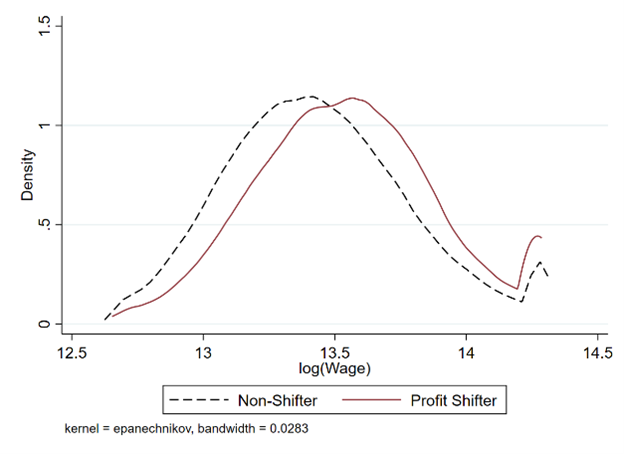
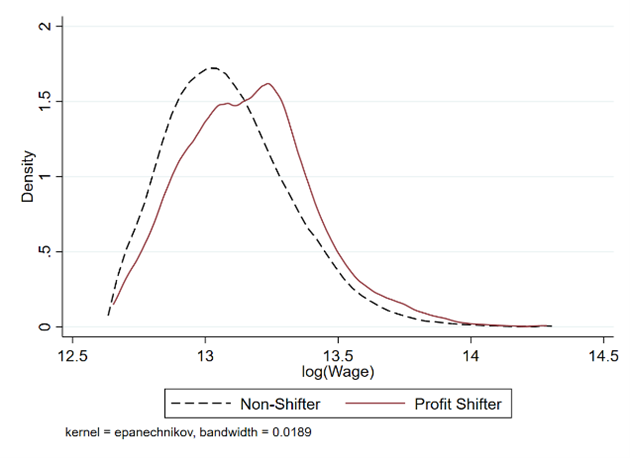
As a first pass, we compare the wage distributions for shifters and non-shifters below. Given differences in skill levels, we do so for both high-skill and low-skill occupations. As shown in the Figures, the wage distribution of profit shifters is to the right of non-shifters, i.e. they pay higher wages. This is especially visible for the high-skill occupations, particularly those who are paid the most.
Wage Distribution (High-Skill Occupations)
Wage Distribution (Low-Skill Occupations)
This comparison, however, does not control for other factors that may affect wages. To account for other factors, we turn to regression analysis. In doing so, we also differentiate between manufacturing and services, on the grounds that intangible assets may play a significant role in profit shifting, implying that firms in services may find profit shifting relatively easier.
For services firms, our estimates suggest a 2% wage premium for the average worker. In contrast, we find no significant wage premium for the average worker in manufacturing. We perform a number of tests of these results to ensure they are robust; for example, these tests confirm that the wage premium is associated with having a haven affiliate, not simply being a multinational. Since moving profits to a haven only makes sense when the recipient is affiliated with the sender, this reinforces that the link is between wages and profit shifting.
While this initial foray only finds a significant wage premium in services, this is an average effect across all workers. When we allow the wage difference to vary by occupation, we find that managers, professionals, and technicians earn about 5% more when working for a shifter, a pattern that holds for both services and manufacturing. In addition, even when compared to other managers, CEOs enjoy a markedly higher wage premium. Thus, even within a firm, profit shifting is associated with greater income inequality.
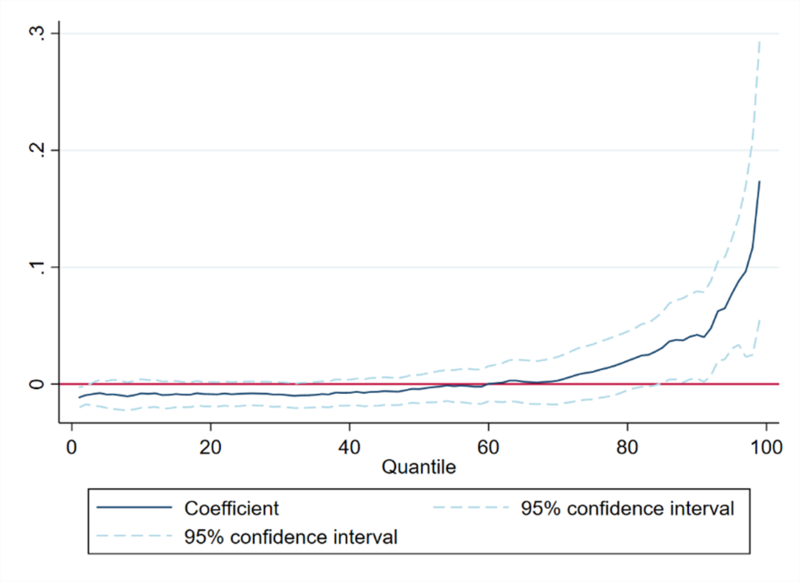
As an alternative way of comparing across workers, we use their wage level rather than their role in the firm. For services, the estimated wage premium across the wage distribution is illustrated in the figure below. The estimates find no significant wage premium until the 85th percentile, i.e. wages are higher only for those already in the top 15% of the wage distribution. Again, this suggests that profit shifting benefits the highest paid workers and contributes to inequality.
Estimated Wage Premium Across the Wage Distribution (Services)
What then do these higher wages mean for government revenues? Using a back-of-the envelope calculation, we estimate that in 2018 profit shifting led to an extra 450 million NOK in wages which itself would have generated an extra 273 million NOK in income and social security taxes. That increase, however, only offsets 12% of the estimated corporate tax losses due to profit shifting. Our overall conclusion, then, is that not only does profit shifting result in a significant revenue loss, without much offsetting effect through other taxes, but it also increases inequality.
This research is reported in full in
Alstadsæter, A., Brun Bjørkheim, J., Davies, R. & Scheuerer, J. (2022), Pennies From Haven: Wages and Profit Shifting, Oxford University Centre for Business Taxation Working Paper 22/04.
Other References
Carbonnier, C., Malgouyres, C., Py, L. & Urvoy, C. (2022), Who benefits from tax incentives? The heterogeneous wage incidence of a tax credit, Journal of Public Economics.
Fuest, C., Peichl, A. & Siegloch, S. (2018), Do Higher Corporate Taxes Reduce Wages? Micro Evidence from Germany, American Economic Review 108(2), 393–418.
Saez, E., Schoefer, B. & Seim, D. (2019), Payroll Taxes, Firm Behavior, and Rent Sharing: Evidence from a Young Workers’ Tax Cut in Sweden, American Economic Review 109(5), 1717–63.
Tørsløv, T. R., Wier, L. S. & Zucman, G. (2018), The missing profits of nations, Working paper 24701, National Bureau of Economic Research.